

Introduction
This topic is about:
- centralizing logs: consolidating logs from different sources, such as system logs or application logs
- enriching logs: adding contextual metadata to enhance the value of collected logs
Motivation: “Logs that are sitting on a drive are just forensic evidence. Logs that are being exploited for insights are power tools“.
Why centralize logs?
Centralizing logs means aggregating logs from multiple sources into a unified platform, to improve visibility into your systems, and eliminate the need to manually log in to individual machines to locate and grep logs.
Benefits:
- facilitate investigations – parse and query logs from a web-based user interface
- correlate events from different sources
- detect anomalies or policy violations
- thwart attacks
- preserve historical evidence from ephemeral instances like containers/pods
- better insights: parse and analyze logs as they arrive
- trigger notifications when certain events occur, or when certain patterns are found (alerting)
- satisfy compliance and data retention requirements
Prerequisites
This topic assumes some experience with Docker (Compose), or willingness to learn. Familiarity with observability concepts and related software solutions such as Prometheus, Grafana, ELK (Elastic Search/Logstash/Kibana) is useful as well.
The following technologies are covered in this tutorial:
- Docker: a container-based virtualization platform
- Fluentd: an open source data collector and aggregator developed by Treasure Data
- Fluent-bit: an open-source telemetry processor and forwarder (comparable to Promtail in the Grafana ecosystem), supported by the CNCF Cloud Native Computing Foundation project
- Grafana: an open-source analytics and visualization web application developed by Grafana Labs – used as a front-end to query logs
- Loki: a log aggregation system developed by Grafana Labs, designed to store and query logs – comparable to Logstash in the ELK stack, but with architectural differences
Goals and philosophy
- Build a log monitoring solution using open-source software, that is suitable for small organizations or a home lab environment
- Design a system that is economical in resources: the software bricks we are using have a moderate footprint, so they do not require expensive equipment. Our solution can be described as a lightweight alternative to the ELK stack. We have been using this setup for years, on a VPS with only 2 Gb of RAM.
- Build a platform that can be self-hosted, and is cheap to operate. No expensive commercial licenses or vendor lock-in.
- Put the emphasis on customization, and ease of integration with third-party software.
- In the spirit of IaC (infrastructure as code), we use Docker compose for ease of deployment
Case study: adding geolocation data to web server logs
Objective: identify the country of origin of visitors from web server logs.
What we want to achieve:
- based on the client IP address, derive geographic origin whenever possible
- augment the logs with additional fields: country, and optionally region/city depending on the granularity provided by the geolocation provider (here: Maxmind database)
We are using the Caddy web server, that can output logs in JSON format. We will be using this format as a default, since it is easily parsed.
A typical configuration file for a reverse-proxied service in Caddy can be defined as follows:
grafana.test.com {
    reverse_proxy grafana:3000
	log {
		output file /var/log/caddy/grafana.log {
			roll_keep 10
			roll_keep_for 168h
		}
		format json
		level INFO
	}
}
A log entry in JSON format looks like this:
{
  "level": "info",
  "ts": 1787091161.3638823,
  "logger": "http.log.access.log1",
  "msg": "handled request",
  "request": {
    "remote_ip": "185.220.100.***",
    "remote_port": "47846",
    "client_ip": "185.220.100.***",
    "proto": "HTTP/2.0",
    "method": "GET",
    "host": "www.test.com",
    "uri": "/wp-content/plugins/wpforms-lite/assets/js/share/utils.min.js?ver=2.0.0.5",
    "headers": {
        "User-Agent": [
        "Mozilla/5.0 (Android 10; Mobile; rv:140.0) Gecko/140.0 Firefox/140.0"
        ],
        "Referer": [
        "https://www.test.com/en/contact-us/"
        ],
    },
    ...
  }
}
The visitor IP address can be found inside the nested JSON field “request”. We are specifically interested in the field “client_ip”.
Docker Compose solution
Our Docker Compose solution is made up of 3 services/containers.
The file tree below shows the final setup. Every file shall be described below.
├── caddy
│   ├── docker
│   │   ├── Caddyfile
│   │   └── Dockerfile
│   └── sites-enabled
│       ├── test.com
├── fluent-bit
│   └── docker
│       ├── conf
│       │   ├── fluent-bit.conf
│       └── Dockerfile
├── fluentd
│   ├── docker
│   │   ├── conf
│   │   │   ├── config.d
│   │   │   │   ├── 01_sources.conf
│   │   │   │   ├── 02_filters.conf
│   │   │   │   ├── 03_dispatch.conf
│   │   │   │   └── 04_output.conf
│   │   │   └── fluent.conf
│   │   └── Dockerfile
├── compose.yaml
First of all, the compose.yaml file:
services:

  caddy:
    build:
      context: .
      dockerfile: ./caddy/docker/Dockerfile
    restart: unless-stopped
    ports:
      - "80:80"
      - "443:443"
      - "443:443/udp"
    env_file:
      - path: ./caddy/docker/.env
        required: true
    volumes:
      - caddy_data:/data
      - caddy_sites:/etc/caddy/sites-enabled/
      - caddy_logs:/var/log/caddy/

  fluent-bit:
    build:
      context: .
      dockerfile: ./fluent-bit/docker/Dockerfile
    env_file:
      - path: ./fluent-bit/docker/.env
        required: true
    restart: unless-stopped
    volumes:
      - caddy_logs:/var/log/caddy/

  fluentd:
    build:
      context: .
      dockerfile: ./fluentd/docker/Dockerfile
    hostname: fluentd
    env_file:
      - path: ./fluentd/docker/.env
        required: true
    restart: unless-stopped
    ports:
      - "24224:24224"
      - "24224:24224/udp"
Services
Caddy
Caddyfile:
import sites-enabled/*
Dockerfile:
FROM caddy@sha256:af5fdcd76f2db5e4e974ee92f96ee8c0fc3edb55bd4ba5032547cbf3f65e486d

COPY caddy/docker/Caddyfile /etc/caddy/Caddyfile

WORKDIR /etc/caddy/sites-enabled
Fluent-bit
fluent-bit/docker/Dockerfile:
FROM fluent/fluent-bit@sha256:ccda4cbd0f87be1e04cc1d5425bc84a6669051d4ac93a6b7a053c3ba9832aa14

# main Fluent-bit config
COPY --chown=fluent:fluent --chmod=0755 ./fluent-bit/docker/conf/fluent-bit.conf /fluent-bit/etc/fluent-bit.conf
fluent-bit/docker/conf/fluent-bit.conf:
[SERVICE]
    # set an interval of seconds before to flush records to a destination
    flush        1

    daemon       Off
    log_level    info

    # absolute file system path to store filesystem data buffers (chunks).
    storage.path  /var/log/flb-storage/

[INPUT]
    Name tail
    Path /var/log/caddy/*.log
    db /var/log/tail_state.db
    Parser json
    Tag caddy.log
    # Add filename field
    Path_Key log_filename

[OUTPUT]
    Name  stdout
    Match *

[OUTPUT]
    Name          forward
    Match         *.*
    Host          fluentd
    Port          24224
    retain_metadata_in_forward_mode false
    compress     gzip
Fluentd
fluentd/docker/Dockerfile:
FROM fluent/fluentd@sha256:b6794cd63b153a2cbc2f7c447ac5036597a3c093b393e786c4fff8abe2c4b911

USER root

# libtool and automake required to build fluent-plugin-geoip
RUN apt update && apt install -y --no-install-recommends \
    build-essential \
    autoconf \
    ruby-dev \
    make \
    automake \
    libgeoip-dev \
    libtool \
    && rm -rf /var/lib/apt/lists/*

# install plugins
RUN gem install fluent-plugin-prometheus fluent-plugin-grafana-loki fluent-plugin-geoip && gem sources --clear-all

# copy configuration
WORKDIR /fluentd/etc/config.d/

# For a Docker container, the default location of the config file is /fluentd/etc/fluent.conf
COPY ./fluentd/docker/conf/fluent.conf /fluentd/etc/fluent.conf

# config is split in multiple files
COPY ./fluentd/docker/conf/config.d/01_sources.conf /fluentd/etc/config.d/
COPY ./fluentd/docker/conf/config.d/02_filters.conf /fluentd/etc/config.d/
COPY ./fluentd/docker/conf/config.d/03_dispatch.conf /fluentd/etc/config.d/
COPY ./fluentd/docker/conf/config.d/04_output.conf /fluentd/etc/config.d/

USER fluent
fluentd/docker/conf/fluent.conf:
@include /fluentd/etc/config.d/*.conf
fluentd/docker/conf/config.d/01_sources.conf:
<source>
  @type forward
  port 24224
  @label @FORWARD
</source>
fluentd/docker/conf/02_filters.conf:
<label @FLUENT_LOG>
  <match fluent.**>
    @type stdout
  </match>
</label>
<label @FORWARD>
  <filter caddy.*>
  @type record_transformer
  enable_ruby true
  <record>
    remote_ip ${record.dig("request", "remote_ip")}
    remote_port ${record.dig("request", "remote_port")}
    client_ip ${record.dig("request", "client_ip")}
    proto ${record.dig("request", "proto")}
    method ${record.dig("request", "method")}
    host ${record.dig("request", "host")}
    uri ${record.dig("request", "uri")}
    # convert Unix time
    converted_time ${Time.at(record['ts'].to_i).utc.strftime('%Y-%m-%d %H:%M:%S')}
  </record>
  </filter>
  <filter caddy.*>
    @type geoip
    # Specify one or more geoip lookup field which has ip address (default: host)
    geoip_lookup_keys $.request.remote_ip
    backend_library geoip2_c
    <record>
    city ${city.names.en["$.request.remote_ip"]}
    latitude ${location.latitude["$.request.remote_ip"]}
    longitude ${location.longitude["$.request.remote_ip"]}
    country ${country.iso_code["$.request.remote_ip"]}
    country_name ${country.names.en["$.request.remote_ip"]}
    postal_code ${postal.code["$.request.remote_ip"]}
    </record>
    @log_level debug
  </filter>
  <match **>
    @type relabel
    @label @DISPATCH
  </match>
</label>
fluentd/docker/conf/03_dispatch.conf:
<label @DISPATCH>
  # Copy log stream to stdout and Loki
<match **>
  @type copy
  <store>
    @type stdout
  </store>
  <store>
    @type relabel
    @label @OUTPUT_LOKI
  </store>
</match>
</label>
fluentd/docker/conf/04_output.conf:
<label @OUTPUT_LOKI>
  <match caddy.*>
  @type loki
  url "http://loki:3100"
  extra_labels {"job": "caddy"}
  line_format json
  <buffer>
    flush_thread_count 8
    flush_interval 5s
    chunk_limit_size 2M
    queue_limit_length 32
    retry_max_interval 30
    retry_forever true
  </buffer>
</match>
</label>
How it works – step by step
- The Caddy web server serves HTTP(S) requests and records logs in JSON format (in /var/log/caddy)
- The /var/log/caddy directory is exposed to Fluent-bit as a shared Docker volume named caddy_logs. Two additional volumes are defined for Caddy: caddy_data to store certificates, caddy_sites to hold website configuration (“virtual hosts”)
- The Fluent-bit container watches the caddy_logs volume, detects changes to monitored files and detects new files when they appear. It essentially works like the Linux tail command.
- A tag “caddy.log” is attached in the metadata. Tags are an essential feature of Fluentd and used to make routing decisions.
- Fluent-bit also uses a small SQLite database to keep track of monitored files, and current offsets (optional but recommended). This allows Fluent-bit to resume work after an interruption (e.g. after restarting the server or upgrading the container)
- New log lines are dispatched to Fluentd over port 24224. Fluentd can receive data in both TCP and UDP, and supports TLS encryption for transport.
- In this setup, the data is also printed to console (stdout) for demonstration purposes, but this can be removed in production.
- Fluentd parses the JSON logs, transforms them, and enriches them according to our instructions.
- The following transformations take place:
- We “flatten” the JSON data partially, and extract the remote IP address from the nested field “request”, along with protocol, port, method etc. NB: the original nested field “request” is left intact in this example, but could be discarded.
- We also convert the Unix timestamp (“ts”) to a human-readable datetime. So, an additional field “converted_time” is created.
- The next stage is to invoke the geoip plugin and attempt to determine the origin of the visitor IP address. The following fields are added to the JSON record: country, country_name, city, latitude, longitude, postal_code (all may be empty)
- The resulting data is saved to Loki for retrieval with Grafana (or any other client).
- An API is also available to query Loki from your own applications.
A log entry in JSON format looks like this after processing (snipped) – note the additional geodata fields:
{
  "level": "info",
  "ts": 1787091161.3638823,
  "logger": "http.log.access.log1",
  "msg": "handled request",
  "request": {
    "remote_ip": "185.220.100.***",
    "remote_port": "47846",
    "client_ip": "185.220.100.***",
    "proto": "HTTP/2.0",
    "method": "GET",
    "host": "www.test.com",
    "uri": "/wp-content/plugins/wpforms-lite/assets/js/share/utils.min.js?ver=2.0.0.5",
    "headers": {
        "User-Agent": [
        "Mozilla/5.0 (Android 10; Mobile; rv:140.0) Gecko/140.0 Firefox/140.0"
        ],
        "Referer": [
        "https://www.test.com/en/contact-us/"
        ],
        ...
        "Accept-Encoding": [
        "gzip, deflate, br, zstd"
        ],
        "Te": [
        "trailers"
        ],
        "Accept": [
        "*/*"
        ],
        "Cookie": [
        "REDACTED"
        ]
  },
        ...
  "log_filename": "/var/log/caddy/wordpress.log",
  "remote_ip": "185.220.100.***",
  "remote_port": "47846",
  "client_ip": "185.220.100.***",
  "proto": "HTTP/2.0",
  "method": "GET",
  "host": "www.test.com",
  "uri": "/wp-content/plugins/wpforms-lite/assets/js/share/utils.min.js?ver=2.0.0.5",
  "converted_time": "2026-08-18 22:12:41",
  "city": null,
  "latitude": 50.1167,
  "longitude": 8.6833,
  "country": "DE",
  "country_name": "Germany",
  "postal_code": null
}
Notes
- To make the setup easier to manage and comprehend, we have split the Fluentd configuration in multiple files. Note that the order of directives matters.
- Logs may contain sensitive information. In our example, the data is transmitted in clear. Because the containers are running on the same host and exchanging data inside a private Docker network, this is not an issue.
- In a production environment that involves servers scattered across different locations, the connection should be secured with TLS, unless you are sending data through a VPN tunnel that already encrypts the traffic. Fluentd supports TLS transport using trusted certificates.
- Fluentd can of course be used to filter logs, remove sensitive data from the logs, or discard data that doesn’t need to be stored.
- Geolocation data is not always reliable or accurate. The quality of the dataset varies from one provider to another. We are using a free source, paid datasets may be more accurate.
- It is recommended to use newer Maxmind libs and databases instead of libgeoip-dev. We have opted for a simpler setup for demonstration purposes.
- For brevity reasons, we have not included details about our Loki instance. If you are interested in more details, drop us a line.
The final product
This is what log visualization looks like in Grafana:
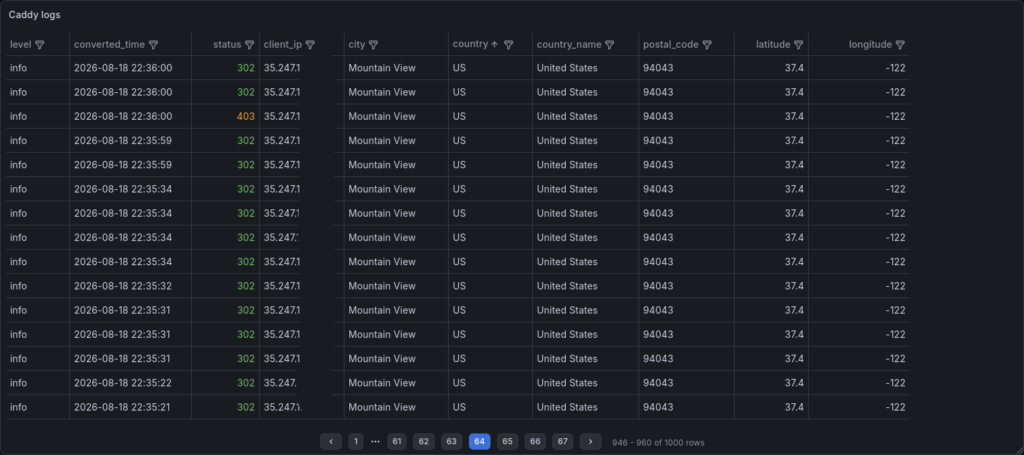
Caddy logs in Grafana with geodata
Alerting
Now you can conveniently centralize logs from different sources, and query the logs from the Grafana UI, which is a marked improvement over the tedious grep commands you would use to inspect the logs. The platform can be used to process all kinds of logs, so we suggest collecting syslog events too, and any other logs that are relevant to your operations.
Obviously, you can’t be reading the logs all day, scrutinizing the screen for errors or warnings. So the logical next step is to add alerting. Loki can integrate with Alert Manager, just like Prometheus, to generate notifications when certain events occur. For example, you can receive notifications by email or over Slack when logs with a severity level of “warning” or “error” are ingested.
Alerting is outside the scope of this tutorial, but we strongly encourage you to explore this topic in order to maximize the value of the platform. Storing logs is useful for investigations and troubleshooting, but proactive action is even better.
Security
- By default, Loki is exposed without authentication. The metrics and the query UI are unprotected.
- Logs should be sent encrypted over the Internet – Fluentd supports TLS for transport using trusted certificates
Conclusion
Logs are an essential tool to gain insights into your systems. Logs also serve as an early warning system against attacks. For example, a SSH login is an event that leaves a trace. Brute force attacks are typically logged as well. If an intruder manages to breach your perimeter, detecting the attack early gives you an opportunity to respond and contain possible damage.
We have shown how to leverage open source software to build a robust and cost-effective platform for logs. By combining Prometheus for metrics, Loki for logs, and Grafana for visualization, you can monitor your systems to ensure they remain healthy and secure at all times.
Feel free to get in touch with us if you are interested in a custom monitoring solution for your organization.
References
- Prometheus – Open source metrics and monitoring for your systems and services
- Alert Manager
- Grafana
- Grafana Dashboards
- Fluentd
- Fluent Bit
- Fluentd forward plugin
- Log aggregation and distribution (Fluentd)
[/fusion_text][/fusion_builder_column][/fusion_builder_row][/fusion_builder_container]